oM Desktop
 |
The openModeller desktop graphical user interface provides a user friendly front end to the openModeller framework. The program runs on GNU/Linux, Windows (9x,ME,2k,NT,XP,7) and Mac OSX. There are two different versions of the application. Both versions are currently unmaintained (please contact the developers mailing list if you're interested in helping). The original wizard version (0.*) was replaced by a more advanced version (1.*) were complex niche modelling experiments involving several algorithms and species can be carried out. You can find more details about the different versions below. |
Version 1.*
Please note that the last released version (1.1.0) includes an older version of openModeller (1.1.0).
Main Features
| • |
A layerset manager. This is for creating named collections of layers for use in modelling experiments. Having layers organised in named sets removes the tedium of repeatedly having to select layers from the file system for different model runs. |
 |
| • |
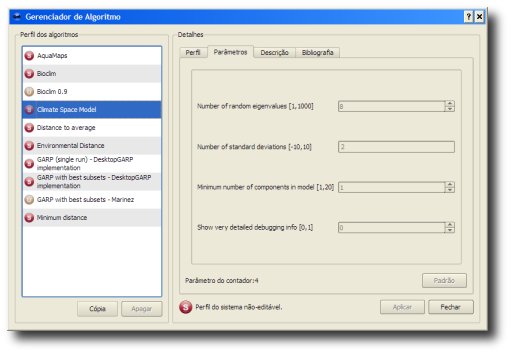
An algorithm profile manager. Algorithm profiles let you store the custom parameters you use for running models in a reusable way. |
 |
| • |
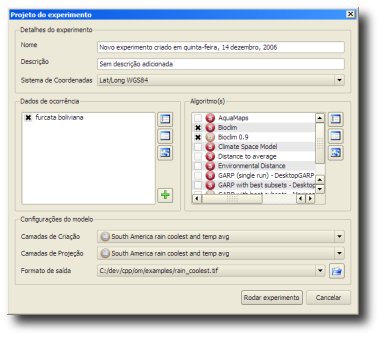
An experiment designer. The experiment designer allows you to set up an experiment consisting of multiple species and algorithm profiles. |
 |
| • |
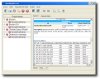
An experiment browser. Once an experiment is completed the experiment browser presents the list of algorithm profiles and the species names in a tree view. Clicking on an item in the experiment tree shows a detailed report for that model. The report includes all the details of which algorithm was used, which parameters for the algorithm were changed, which layers were used, the model duration and so on. |
 |
| • |
A map browser. The map browser allows you to pan and zoom on the model's map image. |
 |
| • |
Translations. Available with Brazillian Portuguese, English and Taiwanese translations. |
| • |
Modelling Plugins. The actual modelling work is managed by plugins, including a 'local' plugin that uses a local openModeller library, and a 'web service' plugin that allows models to be run on a remote server. |
Availability
The software is available in source form (all platforms) and as a binary packages for Microsoft Windows and Mac OSX. If you are an Ubuntu Linux user, step by step instructions for building the application on your system are available.
Tutorial Video
There is also a tutorial video available (~124MB) to help.
Version 0.*
(no longer maintained)
The original version of oM Desktop was developed as a standalone GUI application or as a plugin for Quantum GIS. The program takes the form of a 'Wizard', collecting information from the user via a number of screens. The selections made are saved between sessions thus streamlining the modelling process on subsequent occasions. Click on the thumbnail images below to view full size screen captures. The last version of this software can be downloaded as oM Desktop 0.3.4.
 |
Step 1: The first screen prompts the user to select the modelling algorithm to use. Tabbed pages provide the user with information about each algorithm such as the author details, general description and references. |
| Step 2: The second step asks the user to select a coordinate system. openModeller uses the projection library proj to support using point locality data in any WKT defined coordinate system. |
 |
 |
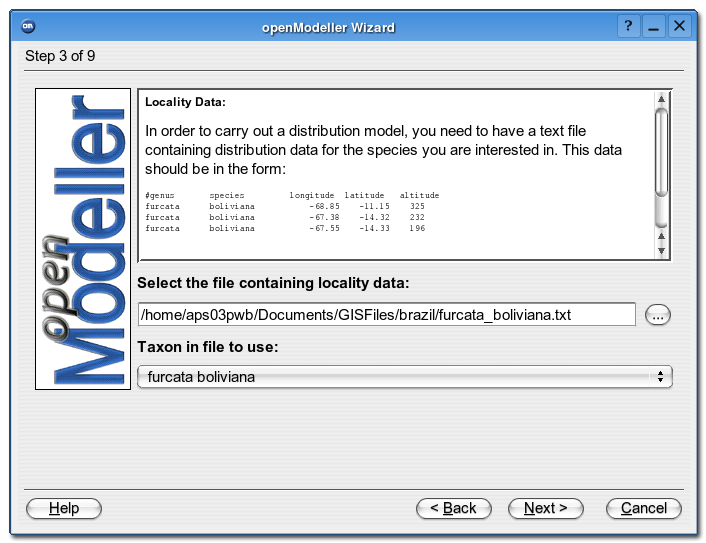
Step 3: Next, the user is asked to load a text file containing the point locality data for the study species. As the text file can contain data for more than one species, the user must then specify which species to use. |
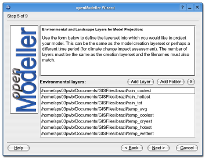
| Step 4: Here the user defines the environmental raster layers with which to build the model. Layers can be specified one by one, or the folder containing all the required files can be selected and openModeller will load them recursively. openModeller uses the GDAL library to read raster surfaces and therefore it supports most of the popularly used GIS data formats. openModeller can use raster layers of different extents and coordinate systems within the same analysis and therefore all raster layers must have coordinate systems defined. |
 |
 |
Step 5: The following page provides a similar interface so the user can specify the layers into which they would like to project their model. This could be the same data as was specified in the previous page (to model the present day potential distribution), or data for a different region or time period. |
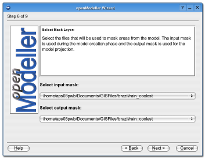
| Step 6: Next, the user is prompted to select the mask layers which will be used to mask the input occurences and to determine the output format. As openModeller supports raster layers of different extents and coordinate systems, the output mask layer specified determines the extent and coordinate system of the resulting prediction. |
 |
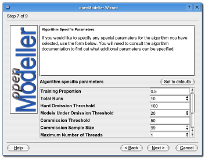 |
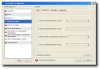
Step 7: Step 7 allows the user to define parameters required for the selected modelling algorithm. The number of available parameters depends on the algorithm selected. By holding your mouse over each box, a tooltip provides a more detailed description of each parameter's function. |
| Step 8: Here the user defines the base file name for the model output files and the folder where these files should be written. The wizard will produce a GEOTIFF image suitable for use in most GIS packages, a configuration file which can be used to run the model again using the openModeller console client and a colour ramped PNG image for initial viewing by the user. |
 |
 |
Step 9: The final wizard screen displays progress bars informing the user of the progress of the model creation and model projection. |
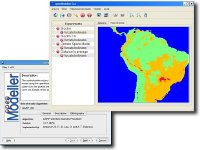
| Step 10: Once the wizard has completed the task, a new window is opened showing the colour ramped PNG image of the model output. The window can be used to save the image in a variety of file formats as well as to open the Wizard to run another model. |
 |
Last updated on 10 March 2014